 For the juvenile justice field, there is no larger question. It’s the elephant in the room, the great mystery, the trend that has changed everything — and seemingly without explanation. Why have juvenile crime rates, once predicted to rise inexorably, instead been falling for two decades? Falling... and falling... and falling.
What if the answer was readily available? What if it mostly boiled down to a single element, hiding in plain sight, and we just refused to notice?
Well, compelling evidence suggests that much or most of the fluctuation in juvenile crime rates does boil down to a single element — a chemical element.
The element is lead, and a powerful body of research indicates that the recent declines in juvenile offending rates, like the rise in juvenile crime rates that preceded them, stem in large part from changes in children’s exposure to lead paint and exhaust from leaded gasoline.
The idea may sound crazy, “like a bad science fiction plot,” quips Rick Nevin, one of the leading researchers documenting the link between lead exposure and crime. But the data don’t lie and here’s what they say.
For centuries it has been clear that lead is a potent poison. At extreme concentrations, lead poisoning causes anemia, blindness, renal failure, convulsions, abdominal spasms, insomnia, hallucinations, chronic fatigue and, ultimately, death. But only in the past four decades have researchers learned that lead exposure can severely damage the cognitive development of children, even at modest levels that produce no physical symptoms. And only through modern scanning technology have we learned that the lead molecule is perfectly designed to cripple young minds in ways that not only lower IQ, but also damage the very parts of the brain that oversee aggression, self-regulation, attention and impulse control.
As Kim Cecil, director of epidemiology and biostatistics at the University of Cincinnati College of Medicine, recently explained to the Chemical & Engineering News, “These are the parts of the brain that say, ‘Ooh, I’ve learned from before that I shouldn’t steal that, or if I do this, then the consequences are that.’”
Even moderate levels of lead in the bloodstream of an infant or toddler significantly increase the odds that he will suffer behavioral disorders in childhood, and will engage in delinquency and criminal behavior later on. (Lead seems to affect boys more than girls.) A study published in 2008 tracked 250 children born in low-income Cincinnati neighborhoods between 1979 and 2004. It found that children with elevated levels of lead exposure (either in utero, or in early childhood) were significantly more likely to be arrested for both violent and nonviolent crimes than children with lower lead exposure. Earlier studies in Philadelphia and Pittsburgh also found a significant correlation between early childhood lead exposure and later conduct problems.
What makes this story important is that children in the United States and worldwide were exposed to massive concentrations of lead throughout much of the 20th century. Because leaded paint dries faster and is more durable, virtually all paint sold in the nation in the first half of the century contained lead. Some nations outlawed leaded paint as early as 1909, but the United States didn’t prohibit the use of lead in interior paints until 1950 and didn’t ban lead paint entirely until 1978.
In 1921, General Motors chemists discovered that tetraethyl lead vastly improved the efficiency of internal combustion engines. By the 1930s, lead additives were included in virtually all gasoline sold in the nation. Faced with increasing evidence about health hazards associated with lead, the Environmental Protection Agency began phasing out the use of leaded gasoline in the 1970s, and banned it entirely as of 1995.
This heavy use of lead in paints and gasoline dramatically increased the amount of lead in children’s bloodstreams. The average among preschool children nationwide rose from less than 5 micrograms per deciliter (ug/dL) of blood through the end of World War II to more than 15 ug/dL by the mid-1950s. Then, after a brief pause, average blood lead levels among U.S. preschoolers surpassed 20 ug/dL during the late 1960s and early ‘70s. The latest studies show that lead can cause permanent cognitive damage at 2.5 ug/dL (or possibly even lower).
Lead levels were especially high for inner-city black children due to both lead paint chips from older, dilapidated housing and high volumes of exhaust from urban roadways. Data from 1976-1980 show that 63 percent of black children 5 and under in central cities had blood lead levels of 20 ug/dL or higher, and 18.6 percent had levels above 30 ug/dL — a rate nearly five times the national average.
Then, in the 1970s, regulations were issued to limit and prohibit lead, and lead levels began falling for children of all races. They continue to fall until the present day, though racial disparities persist.
The full ramifications of this massive lead exposure began coming into view in the mid-1990s when Rick Nevin, a senior economist with ICF International, undertook a study for the federal Department of Housing and Urban Development examining the costs and benefits of removing lead from older homes in U.S. cities. For the study, Nevin dug up several decades of data on gasoline lead emissions and compared them with violent crime rates years later. The correlations were striking. For every type of violent offense, as lead emissions rose or fell there was a nearly identical change in the offense rate two decades later. Unwed teen pregnancies followed a similar pattern, Nevin found.
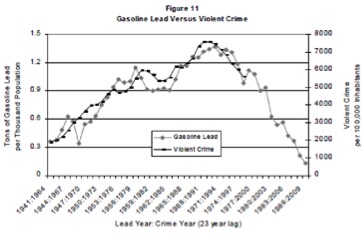
This chart, from Rick Nevin’s first academic paper, documents the striking correlation over time between lead emissions and violent crime (with a 23 year lag).
In 2000, Nevin pulled his data together into an article for a respected academic journal, Environmental Research. Seven years later, Nevin published a second article demonstrating that the lagged connection between early childhood lead exposure and subsequent criminality held true in a number of other nations as well. Changes in lead exposure, Nevin found, explained at least 63 percent of the variation in crime rates over time for each of nine nations studied. Meanwhile, another 2007 study showed this same correlation at the state-level within the nation, as states with sharper or earlier reductions in lead emissions demonstrated sharper and earlier drops in crime. Subsequent studies have found that the correlation also holds at the neighborhood level within cities.
Could these striking correlations between lead exposure and crime rates be coincidence? That’s always a possibility, particularly in situations where the gold standard for scientific inquiry — a randomized trial — is unavailable. (Subjecting a random sample of infants to lead is obviously out-of-bounds.) Yet the strength and consistency of the findings linking lead exposure and crime trends, plus the wealth of corroborating evidence from other disciplines (such as brain imaging studies and longitudinal studies of small population samples in selected cities) creates what Kevin Drum, a widely-cited blogger and journalist who has written extensively on the lead-crime connection, calls “an astonishing body of evidence.”
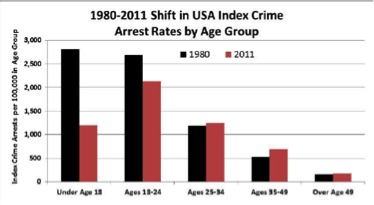

The above two charts show the differential trends in offending (as measured by arrest and incarceration rates) for successive generations. Both show gradually decreasing criminal involvement for successive youth cohorts (with lower and lower early childhood lead exposure), combined with flat or increasing criminal involvement for older adults who had heavier exposure to lead in early childhood).
“We now have studies at the international level, the national level, the state level, the city level, and even the individual level,” writes Drum. “Groups of children have been followed from the womb to adulthood, and higher childhood blood lead levels are consistently associated with higher adult arrest rates for violent crimes. All of these studies tell the same story: Gasoline lead is responsible for a good share of the rise and fall of violent crime over the past half century.”
By this point, readers of this column may be wondering: If the evidence linking lead exposure and crime is so strong, why haven’t we heard more about it? The primary reason is that the research has been largely ignored by academics. In 2008, a 250-page report on U.S. crime trends by the National Academies of Science included only one paragraph about lead exposure, drawing no conclusions. Late last year, a National Academies roundtable on crime trends did hold a session on lead exposure.
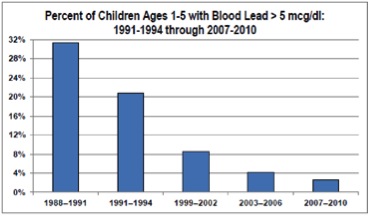
This chart shows how dramatically the early childhood lead levels have continued to decline in recent times, including a drop in cohorts that have yet to reach juvenile age. If the lead-crime connection is real, this suggests that delinquency rates are likely to continue falling in the coming years.
But even in that day’s session, the opening presentation — delivered by the renowned British criminologist, David Farrington — did not include a word about lead exposure. His talk on “Individual Differences in Antisocial Behavior, Delinquency, and Crime” discussed unemployment, parenting, poverty, family size, peer influences, substance abuse, and even an individual’s resting heart rate — none of which has seen changes in recent times consistent with the larger rise and fall in crime rates. Farrington said nothing about the introduction and subsequent removal of massive amounts of a toxic substance with a powerful known link to subsequent delinquency and criminality.
Drum suggests that the lack of attention to lead exposure is natural, given that the theory is new and unproven. Indeed, some critics have raised legitimate questions about the research — citing the small number of studies, questioning methodology and suggesting that other factors beyond lead (such as demographics, shifting drug markets and more) may also play an important role in determining crime rates over time.
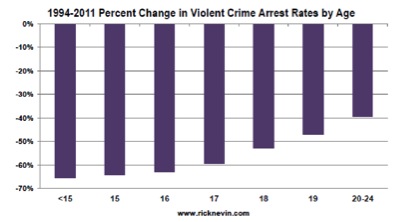
The above chart shows a trend toward lower and lower juvenile offending in recent times among each age cohort of youth.
For instance, Florida State University criminologist Eric Baumer, the designated discussant at the recent National Academies roundtable, noted that crime declined significantly in the 1990s among all age cohorts, not just youth and younger adults with reduced lead exposure. Baumer also noted that the share of youth and young adults in the population has been declining in most industrial nations since the 1980s, perhaps fueling the steady drop in crime rates. And he pointed to the fact that, although statistically significant, the increases in criminality associated with early childhood lead exposure were fairly modest in the Cincinnati youth study. Although Baumer accepted that the evidence yields a “persuasive case for a significant association” between lead exposure and crime rates, he raised the possibility that the connection might be “spurious,” and he questioned whether the lead effect — even if real — would be sufficient to explain large aggregate reductions in crime rates. Even with these caveats, however, Baumer described the lead research as “provocative and plausible.”
(Rick Nevin roundly rejects Baumer’s critique of the lead research, noting that Baumer ignores some of the strongest evidence of the lead exposure hypothesis and uses inappropriate data to support his other criticisms. Bottom line, says Nevin: no other theory “has demonstrated any comparable predictive accuracy in forecasting ongoing international crime trends.” Click here for Baumer’s presentation, and here for Nevin’s rebuttal.)

The above Bureau of Justice Statistics chart shows how big cities, which suffered the worst lead exposure in the post-war years and have benefitted the most from lead abatement efforts and the ban on leaded gasoline, have seen a far greater drop in homicide rates than smaller and mid-sized cities (where lead played a lesser role).
Another factor behind the inattention to the lead exposure research is that most of the studies thus far have been conducted by economists and public health scholars, not criminologists, and the key papers have been published in environmental journals rather than criminology publications. Nevin also sees an element of self-interest: “Everyone has their own theory that they hold dear about why the crime decline has occurred,” he says. “There are a whole lot of people ... on both sides of the political spectrum who want to claim credit for this and don’t really like hearing about this unrelated powerful force.”
Whatever the reasons, this lack of attention has left policymakers and juvenile justice practitioners unaware of lead’s apparently pivotal impact on adolescent (and adult) offending rates over the past half century.
What does this connection between crime and lead exposure mean for the juvenile justice field?
First, it sheds light not just on the sharp rise and dramatic fall in national delinquency rates in recent decades, but also on a number of other previously unexplained trends as well. The stark racial and geographic disparities in lead exposure help explain how America’s city’s became havens of violence in the post-World War II era, and why crime rates in central cities have fallen so significantly since as lead exposure rates declined. The murder rate in America’s largest cities (where lead exposure rates were highest) declined by two-thirds from 1991 to 2008, and is now equal to rates in small and mid-sized cities.
Declining lead exposure also helps explain why both arrest and incarceration rates are falling for adolescents and younger adults nationwide (who are benefiting from lower lead exposure), while rising for adults over age 35 (who were born at the height of the lead era). And why the U.S. teen pregnancy rate has fallen 51 percent since 1991. And it also helps explain why, despite continuing sky-is-falling media coverage of America’s education system, fourth and eighth grade students in every major demographic group have significantly improved their test scores over the past two decades.
Second, just as the big drop in juvenile offending shredded the logic and underlying analysis of so-called experts in the 1990s who predicted a ticking time bomb of adolescent crime fueled by juvenile superpredators, the emerging data linking lead exposure and offending rates also injects a needed dose of humility for today’s juvenile justice advocates and practitioners.
Across the country, as juvenile offending and custody rates have fallen, juvenile justice officials and some advocacy organizations have tried to claim credit — chalking up the progress to their own policies and practices. Of course, some reform efforts have made significant difference. Connecticut, Ohio, Louisiana, Texas and California have all dramatically reduced confinement in recent years after passing new legislation or embracing new policies to limit the range of offenses for which youth can be confined, boost investments in non-residential programming, or change the financial incentives to encourage localities to offer a stronger array of community‐based services. And many sites nationwide have reduced detention populations as part of the Annie E. Casey Foundation’s Juvenile Detention Alternatives Initiative. But looking across the country, game-changing reforms remain the exception in juvenile justice, not the rule.
For instance, juvenile justice scholar Jeffrey Butts has shown that U.S. delinquency courts were no less likely to incarcerate youth in 2009 than they had been in 1995. Nationwide, there was virtually no change in youth incarceration as a share of total delinquency cases (about 9 percent every year), all cases where formal charges were brought (about 16 percent every year), and all cases adjudicated delinquent (about 27-28 percent every year). Meanwhile, a new five-site study by the National Council on Crime and Delinquency released this spring found that youth adjudicated delinquent were actually more likely to be placed into correctional or other residential facilities in 2012 than in 2002. As the Casey Foundation put it two years ago, “it is less clear whether [recent trends in youth confinement] reflect a genuine de‐incarceration movement, or rather signal that this is an opportune time to start one.”
Third, early childhood lead exposure has continued to decline steeply in recent years, meaning that youth entering adolescence over the next decade will have lower lead exposure than today’s adolescents. As a result, juvenile offending rates are likely to sustain their downward trend for the foreseeable future. That’s one more reason why now is an ideal time to initiate meaningful reforms in juvenile justice — including real reductions in the use of out-of-home placements.
Finally, returning to the humility theme, the lead data suggest that perhaps the most important thing our nation can do to reduce juvenile crime — and also to boost youth success in general — has nothing to do with juvenile courts or corrections systems. Maybe our first priority should be lead abatement — finishing the job by removing the last remnants of our tragic 20th century fetish with this terrible toxin.
Dick Mendel is an independent writer and editor on juvenile justice and other youth, poverty and community development issues. He has written nationally disseminated reports for the Annie E. Casey Foundation, American Youth Policy Forum and Justice Policy Institute, among others.

Pingback: “A black male baby born today … stands a” near-zero chance of going to prison | Rick Nevin
Pingback: A black male baby born today, if we do not change the system, stands a” … near-zero chance of going to prison | Rick Nevin
Pingback: CDC reports encouraging trends in teen health
Pingback: Teenagers Are No Longer the Scary Delinquents of 30 Years Ago - GreenEnergy4.us
Kevin Drum has a post at http://www.motherjones.com/kevin-drum/2013/01/does-lead-paint-produce-more-crime-too that shows an updated version of my graph of homicide trends tracking the rise and fall of lead use in paint in the first half of the 1900s and then the rise and fall of lead use in gasoline since 1960. Although the lead content of interior paint wasn’t restricted until the 1950s, zinc paint became widely used on interior surfaces over the 1920s, and the concentration of lead in the paint that did contain lead also fell due to the use of lead-zinc mixtures in paint. The decline in crime rates after WWII reflected that earlier decline in the amount of lead used in paint.
“… the United States didn’t prohibit the use of lead in interior paints until 1950 and didn’t ban lead paint entirely until 1978. . . .By the 1930s, lead additives were included in virtually all gasoline sold in the nation. . . .the Environmental Protection Agency began phasing out the use of leaded gasoline in the 1970s, and banned it entirely as of 1995.”
How does this theory explain the dramatic drop in crime rates following World War II?
Well written and absolutely true. Academics have agendas. Many have blamed genetics for decades, which is non-sense, so they could get more funding from eugenic factions in government, and others are funded by industry like Dupont and Dow that made the mess to begin with or insurance that defends brain damage claims caused by them. Crime is an industry. Poverty is a wedge political issue. Finally, the social scientists, like criminologists, tend to have a herd mentality, so the break out theories tend to be ignored.
Again, great job.